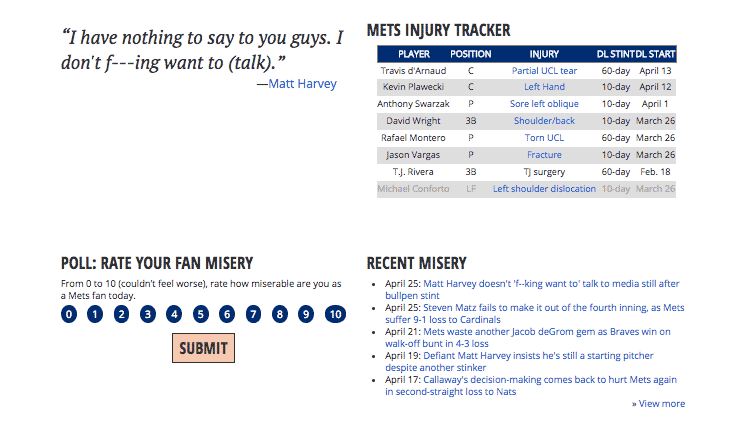
A Google Sheets-powered one-page app that allows the sports editors to quantify the New York Mets’ misery on a day-by-day basis.
Nobody had high hopes for the Mets coming into the 2018 season. Working with the Sports desk, we built a one-page interactive to capture and quantify the misery of the Queens, New York, ballclub. The interactive includes a misery score (calculated by a back-end misery equation), a featured quote, and a Mets injury tracker, all administered by the sports editors via Google Sheets.
What I did
I worked with the sports department, who told us what they wanted in the interactive, and the other interactive developer, who designed the interactive and wrote the CSS.
The technical aspects included:
- Backend python code that looks for updates in the Google sheets and writes the new data to JSON files.
- Custom vanilla Javascript that ingests the JSON and builds the dynamic parts of the page.
- Wrote the HTML and CSS in the embeddable widgets used in related articles.
Mets Misery Index project links
* Link retired: The server hosting this wasn't upgraded to serve https requests.